
Tune Out The Noise
Daily, weekly or monthly? Some thoughts on timeframes when analyzing price charts.
Over the years, I’ve joked with colleagues and friends that if I were to rid daily candlesticks completely from my process, my portfolio would greatly benefit. Although this was said jokingly, I continue to come back to the idea and often consider implementing the rule into my process. Ask any price focused investor, daily charts carry A LOT of noise. By focusing primarily on weekly and monthly charts, we’re able to smooth out price swings that have no meaningful impact on primary trend direction. Just take a look below at the two charts of Apple Inc.

In 2016, the daily chart gave investors a plethora of reasons to sell the stock and/or have a bearish near-term outlook (as if anyone knows where stocks are going in the short-term). For investors who claim daily charts assist with entry/exit points - I say, “eh kinda.” In my opinion there is nothing that can be performed on a daily chart that cannot also be performed on a weekly or monthly. Stop loss included. I’d argue using weekly candles involving Average True Range (ATR) is a much better recipe for stop loss than using daily charts with the same ATR formula.
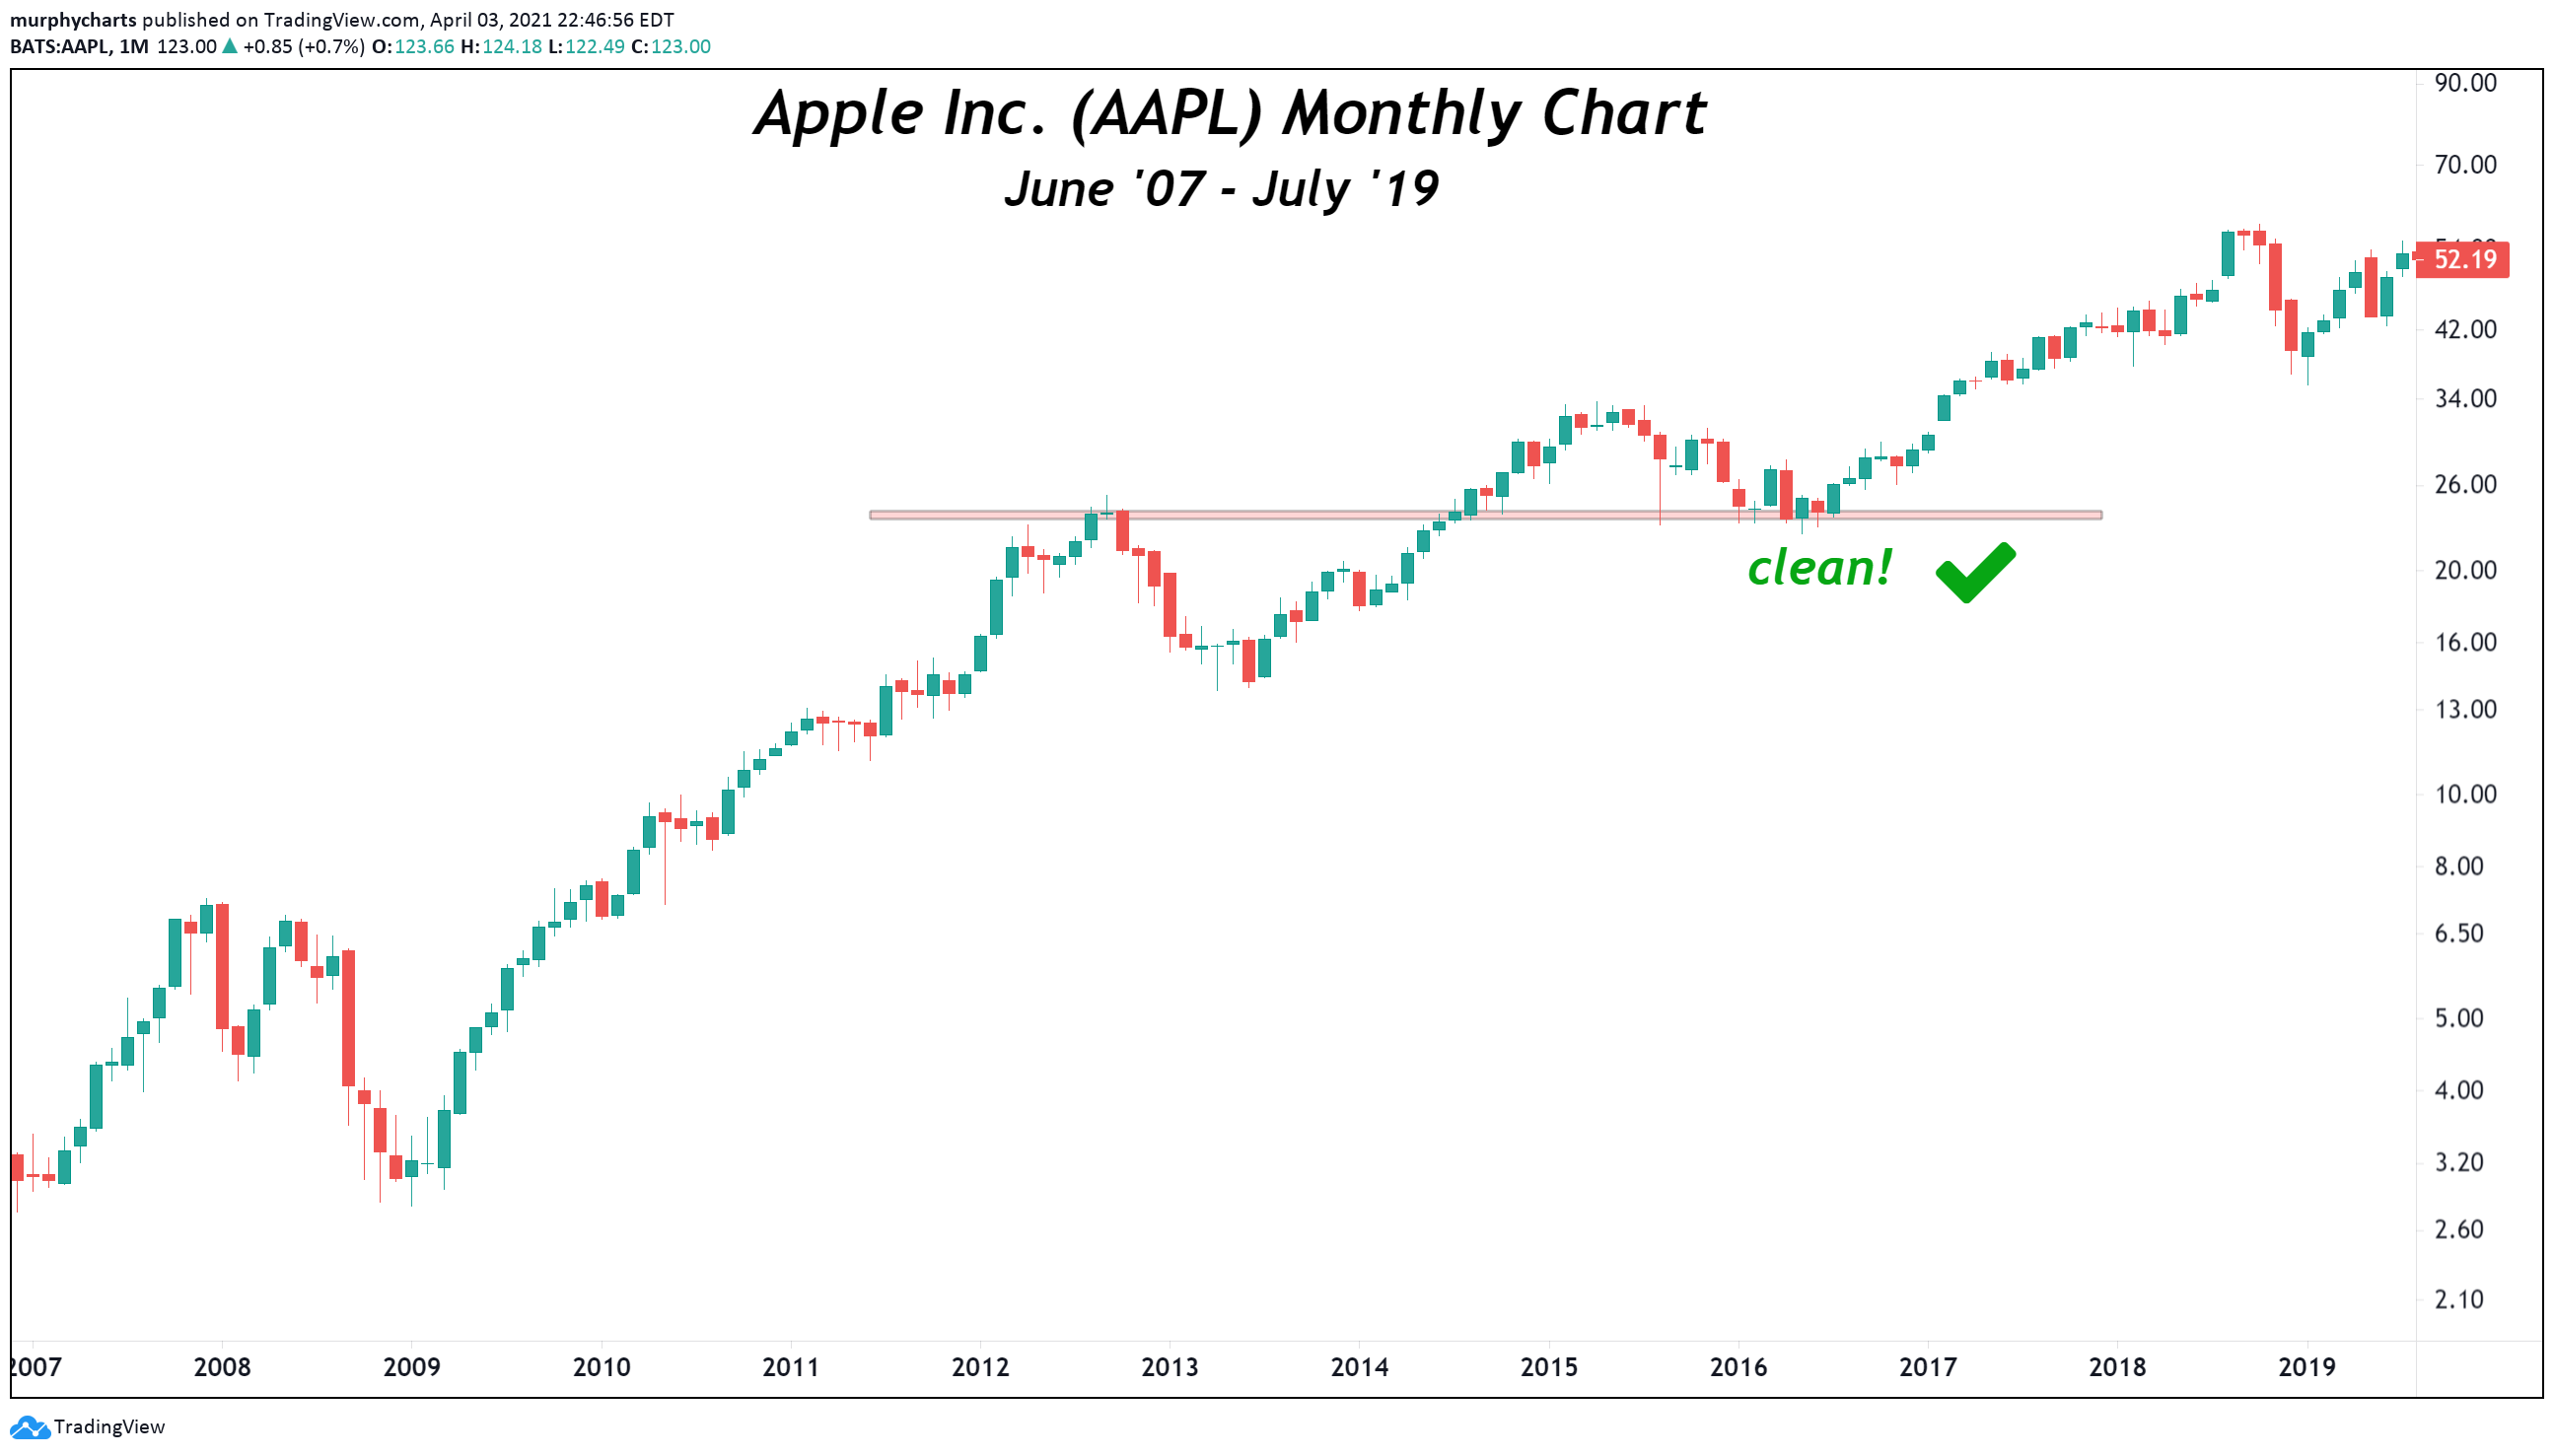
When it comes to monthly charts, the reduction in noise is beneficial to long-term investors. Weed out the noise, focus on trend and your portfolio will thank you. Disagree? Let me know!
That’s enough outta me.
SM
Well written article 🍀