I feel a change comin' on
And the fourth part of the day's already gone- Bob Dylan
The S&P 500 Index is the most watched and widely traded stock index in the world. It is made up of the leading 500 publicly traded US companies. The index spans across 11 sectors and covers 80% of available market capitalization.
The S&P 500 is a market capitalization weighted index, meaning a higher percentage allocation is given to the largest companies. In other words, the bigger the company, the bigger the impact on the index.
For example, Apple Inc. has a market cap of ~$2.7 trillion. Apple is currently the largest weighted holding, accounting for over 7% of the index. Meanwhile, a company like McDonalds Corp has a market cap of ~$187 billion, resulting in a weighting of only 0.51%.
Given the two company weightings, a +1% move in Apple stock will have a larger impact on the direction of the index than a +1% move in McDonalds stock.
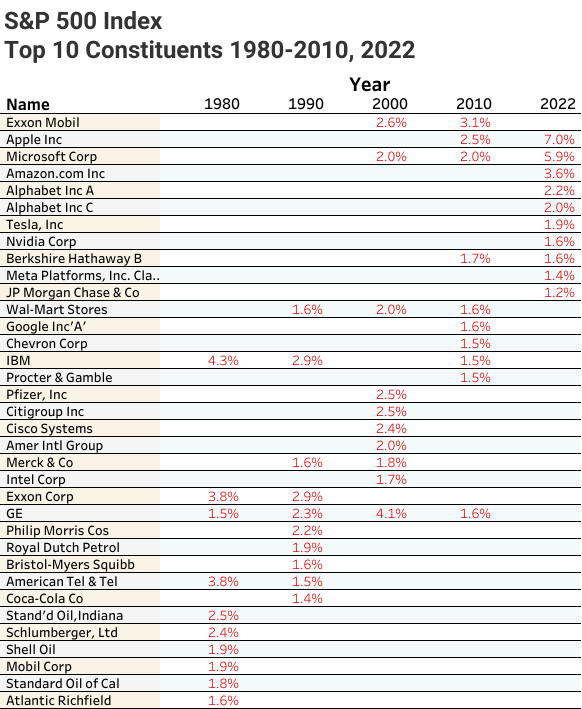
If history is any indicator, it is unlikely that in 30 years, the top 10 constituents will look anything like the top 10 of today. Below is a chart displaying the S&P 500 index top 10 by decade, including the most recent float adjusted weightings from February 2022.
Not a single individual stock from 1980 or 1990 is still in the top 10 by 2022. That’s right, not one. It is notable that in 1980, International Business Machines (IBM) was the largest weighted stock in the index at 4.3%. Over the next 30 years, its weight was reduced to 1.5% and by 2022 the company’s index weighting fell to just 0.32%.
But how did IBM fare in performance relative to the S&P 500 over this time period? Below is a simple ratio chart. IBM stock is the numerator and the S&P 500 is the denominator. When the chart is trending up, IBM is outperforming. Trending down, S&P 500 is outperforming.
Since December 1990, the S&P 500 has grown at a CAGR of 8.7%, meanwhile IBM has grown at a CAGR of only 5.1%. It’s safe to say this individual stock has underperformed the very index it once dominated.
Economies evolve. Investing in an index that adapts as new leaders emerge and old one’s fade away, makes a lot of sense. The purpose of this post is to highlight the brilliance of the S&P 500 Index construction and note that individual stock investing can result in underperformance over the long-term. There are hundreds of indices out there that follow a similar weighting methodology. One that piques our interest is the Morningstar US Dividend Growth Index. Below is an excerpt taken from its methodology packet.
“Constituents are weighted according to a fundamental, dividend-based weighting system. The index’s available dividend model emphasizes company size as well as dividend yield. We calculate available dividend dollars for each stock by multiplying indicated dividend per share by the number of shares actually available for purchase (the float).”
Quite interesting. This approach retains the benefits of market cap weighting and also anchors the index to shares of quality large-cap stocks. If you were to compare the top 10 names of this index and the S&P 500 Index, you’d notice some big differences!
Indices are being constructed everyday with added filters and new approaches that help investors capture a certain factor or fundamental quality of the market. From dividend growth, to share buybacks, spinoffs, quality yield, value, cap size etc. It’s a wonderful time to be a market participant!
Lastly, we’d like to share with you the below chart highlighting the top 10 index constituents as a percentage of total index value. At no time in history, have the top 10 names in the S&P 500 index accounted for this much of its total value (~30%). History says, that as a top 10 regime change occurs, this percentage should move back in line with its historic average (around 21%). It will be interesting to see if this takes place over the next 10-20 years!
This material is intended for informational/educational purposes only and should not be construed as investment advice, a solicitation, or a recommendation to buy or sell any security or investment product. All indices are unmanaged and investors cannot actually invest directly into an index. Unlike investments, indices do not incur management fees, charges, or expenses. Past performance does not guarantee future results. Please contact your financial professional for more information specific to your situation.


Thumbs up!
Thumbs up!