Stock market breadth refers to the participation (or lack thereof) of individual stock issues given a move in the overall index. Breadth can be evaluated by reviewing stocks held within an index or listed on a stock exchange.
For example, an index is forming new highs, but a breadth indicator measuring individual stock participation is failing to make new highs. This divergence is considered evidence against the strength and sustainability of the index’s price move. Breadth should always be reviewed in conjunction with other indicators and/or data. Generally speaking, breadth gauges are used as confirmatory evidence of what price is already telling us.
There are many indicators available that measure stock market breadth. Some count the number of stock issues advancing versus declining. Some include moving averages and others even incorporate volume.
We will now review five breadth indicators, focusing primarily on the S&P 500 Index. Before we dive into them, it’s important to note that using breadth indicators with the largest # of stock issues makes intuitive sense. Why limit yourself to 500 stocks when you can review an entire exchange? New York Stock Exchange (NYSE) data is one of the most popular. With that being said, for this post we will primarily review only the 500 listed stocks held in the S&P 500 Index.
Moving Average Breadth: % of SPX stocks above 200-day average
This breadth indicator is one of my favorites. It’s a very simple calculation and it tells us a lot about the true participation in the index. Divergences and confirmation of new highs are extremely notable. As of today, the indicator is trading at new weekly closing highs.
S&P 500 Index: Advance-Decline Line
This indicator calculates the total difference between stocks advancing and declining. It’s a cumulative momentum indicator, used to confirm the existing price trend in the index. The A/D line is at new all-time highs, confirming the existing trend in stock prices.
S&P 500 Index: On-Balance-Volume (OBV)
OBV uses volume to confirm index price trend. It can be viewed as a breadth and/or sentiment gauge. Divergences and confirmation of price moves are notable. The slope of the OBV line is also incredibly important. As of today, the OBV line is upward sloping but is yet to confirm new highs witnessed on the index.
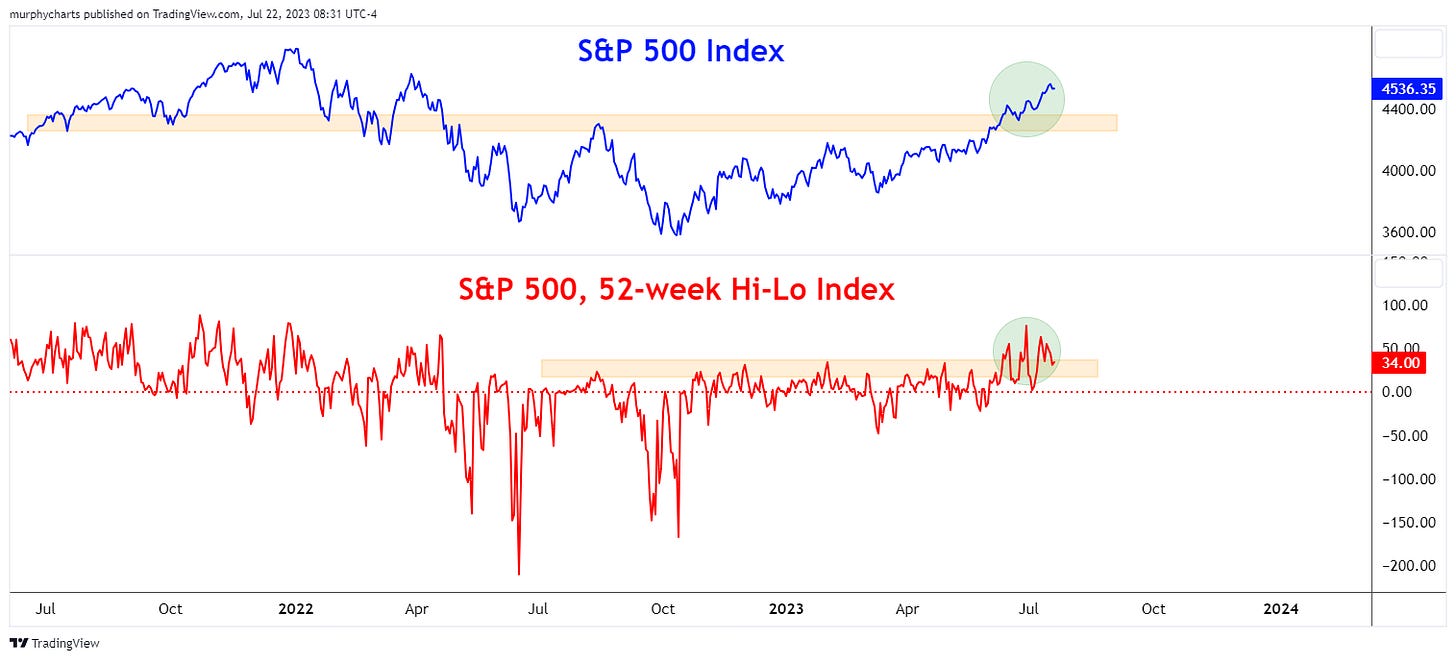
S&P 500 Index: 52-week Hi-Lo Index
This index measures the number of SPX stocks reaching new 52-week highs less SPX stocks forming new 52-week lows. Like other breadth gauges, its purpose is to confirm the primary trend of the index. We witnessed the 52-week Hi-Lo confirm SPX new highs back in June.
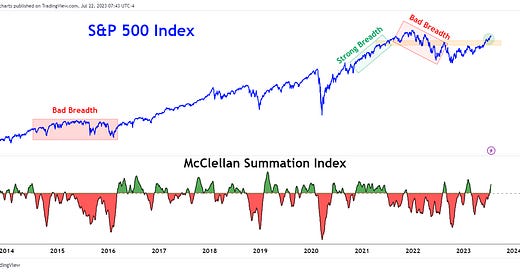
McClellan Summation Index (MSI)
One of the more popular breadth indicators, this index uses NYSE stock issues to gauge participation and help confirm the trend in stock prices. Learn more about this indicator and its history here. MSI is geared toward longer-term trends (filters out a lot of noise). MSI flipped positive this month, confirming the existing trend in stock prices.
There you have it - five breadth indicators that can help us better confirm existing trends in the market. Questions or comments, drop a note!
That’s enough out of me.
SM


Shane -
Since SPX is a cap-weighted index, would it be even more telling if the breadth indicators incorporated size? For example, would the 52-week hi-low index be a more accurate indicator if each underlying stock was weighted by market cap? Not sure if this would make much of difference but just a thought I had and wanted to hear your views.
Great read