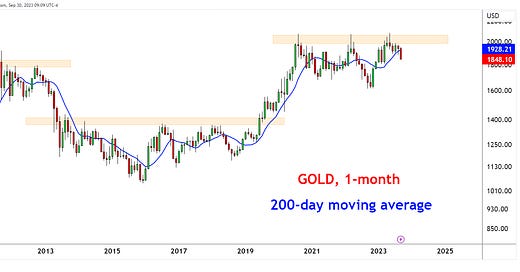
Gold (US$/OZ)
Over the last 2-years, Gold has struggled to digest overhead supply. In May ‘23, the yellow metal put in a new intra-day all-time high - just a few months later and price is below the 200-day moving average eyeing the ‘23 lows. Yuck.
Natural Gas
For mean-reversion / change of trend style investors, it doesn’t get much better than this. Natural gas futures close the month above the 200-day moving average.
Commodities vs. Stocks
In Q3, commodity indices moved back above an upward sloping 200-day moving average. Commodities vs. Stocks price ratio is also back above the 200-day average.
Dollar + Long Bond Yield
Best 2-month stretch for the US Dollar Index since September 2022. Trading above the 200-day moving average.
Rates continue to climb higher as flows poor into long-duration bond ETFs. The 30yr US Treasury Yield is coming into a technical area of interest.
Russell Microcaps
Microcaps are retesting the cycle lows, forming a new monthly closing low. Not what we typically see in a recovery.
Nasdaq 100 Moving Average Breadth
Nasdaq 100 taking a breather. Long-term moving average breadth is below its 200-day moving average.
US Aggregate Bond Index
Weekly chart of the US Aggregate Bond Index. Difficult month for bond fund holders. Price is below the 200-day moving average with trend indicators telling us to expect more pain.
That’s enough out of me. Onward to October!
SM


Great charts!