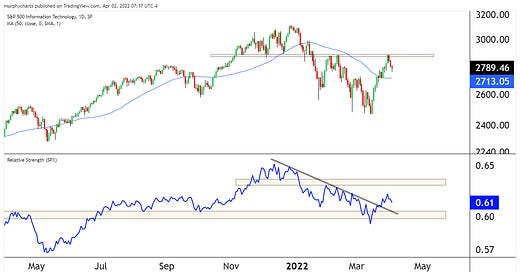
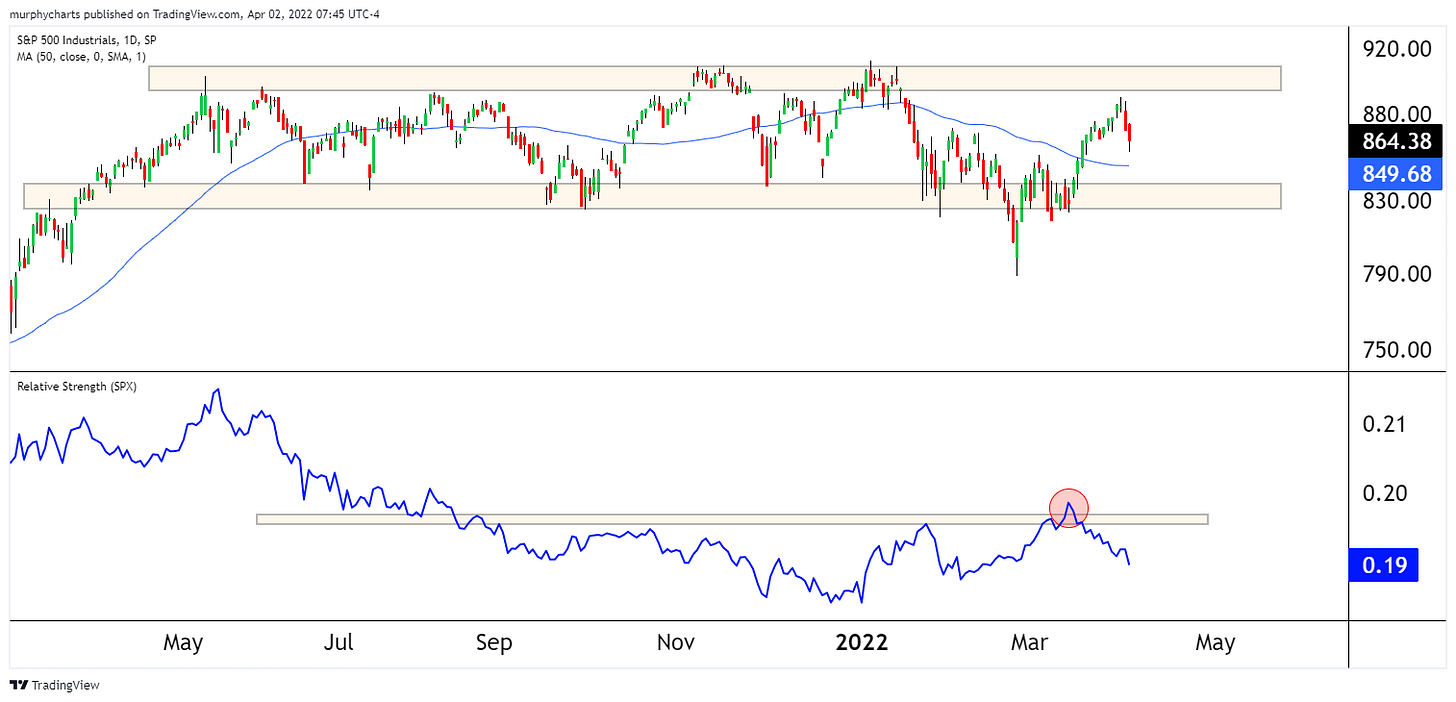
Top Pane = absolute price of sector index
Bottom Pane = relative strength chart (Sector Index versus S&P 500 Index)
1. Information Technology (S&P 500 Index weighting: 28%)
The sector failed to close above its February highs. The principle of polarity (prior support becomes new resistance, vice versa) can be applied at the ~2,900 level on the sector index. Relative strength (RS) chart saw a tick up in March but remains below the February highs.
2. Health Care (S&P 500 Index weighting: 14%)
Defensive sector, outperforming the S&P 500 on a YTD basis. Well tested support zone around 1,450. RS chart trending higher since December 2021. Defensives (HC, Utes, Staples) all outperforming the S&P 500 YTD.
3. Consumer Discretionary (S&P 500 Index weighting: 12%)
Closed above the February highs, but failed to hold. RS Chart failed to form new highs in March. The sector remains in a relative downtrend.
4. Financials (S&P 500 Index weighting: 11%)
The only US Sector currently below its 50-day moving average. Financials have done nothing over the last twelve months on a relative basis. This past week, the sector formed new multi-month relative lows.
5. Communication Services (S&P 500 Index weighting: 9%)
Valid downtrend on both a relative and absolute basis. However, the sector is currently trading above its 50-day moving average.
6. Industrials (S&P 500 Index weighting: 8%)
The sector has been range-bound over the last twelve months. RS chart formed a bottom in December 2021. Broad market rally during the 2nd half of March saw a decline in the Industrials sector RS chart.
7. Consumer Staples (S&P 500 Index weighting: 6%)
The defensive sector is coming up on all-time highs. Trending higher on an absolute basis. RS chart saw a pause during the month of March.
8. Energy (S&P 500 Index weighting: 4%)
The sector has remained above its 50-day moving average for all of 2022. Market leader YTD by a very wide margin. Strong uptrend on both an absolute and relative basis.
9. Utilities (S&P 500 Index weighting: 3%)
Defensive sector seeing fresh all-time highs. After a nearly 2-year relative downtrend, the sector is now forming higher highs and higher lows, eyeing new YTD relative highs.
10. Real Estate (S&P 500 Index weighting: 3%)
Rangebound for the last twelve months. Trading at significant S/R zones on both price charts.
11. Materials (S&P 500 Index weighting: 3%)
Difficult 2nd half of 2021. However, the sector is forming multi-month relative highs. Absolute price chart remains rangebound.
That’s enough out of me!
SM
This material is intended for informational/educational purposes only and should not be construed as investment advice, a solicitation, or a recommendation to buy or sell any security or investment product. All indices are unmanaged and investors cannot actually invest directly into an index. Unlike investments, indices do not incur management fees, charges, or expenses. Past performance does not guarantee future results. Please contact your financial professional for more information specific to your situation.


Great summary🍀