


Natural Gas Bucks Seasonal Headwinds
It’s been a great year for the commodity trade. Natural gas futures are +52% year-to-date. Yes, you read that right. +52%. Only 2 other CRB Index components are displaying stronger year-to-date returns, RBOB Gasoline (+58%) and Lean Hog futures (+56%).
Typically, the summer months spell trouble for natural gas bulls, especially July. Over the past 20 years, the average return for Natural Gas during the month of July is -1.60%. Only 30% of the time, did it close the month higher than how it opened. Despite the anticipated seasonal lull, Natural Gas futures closed the month of July with a return of +7.8%.

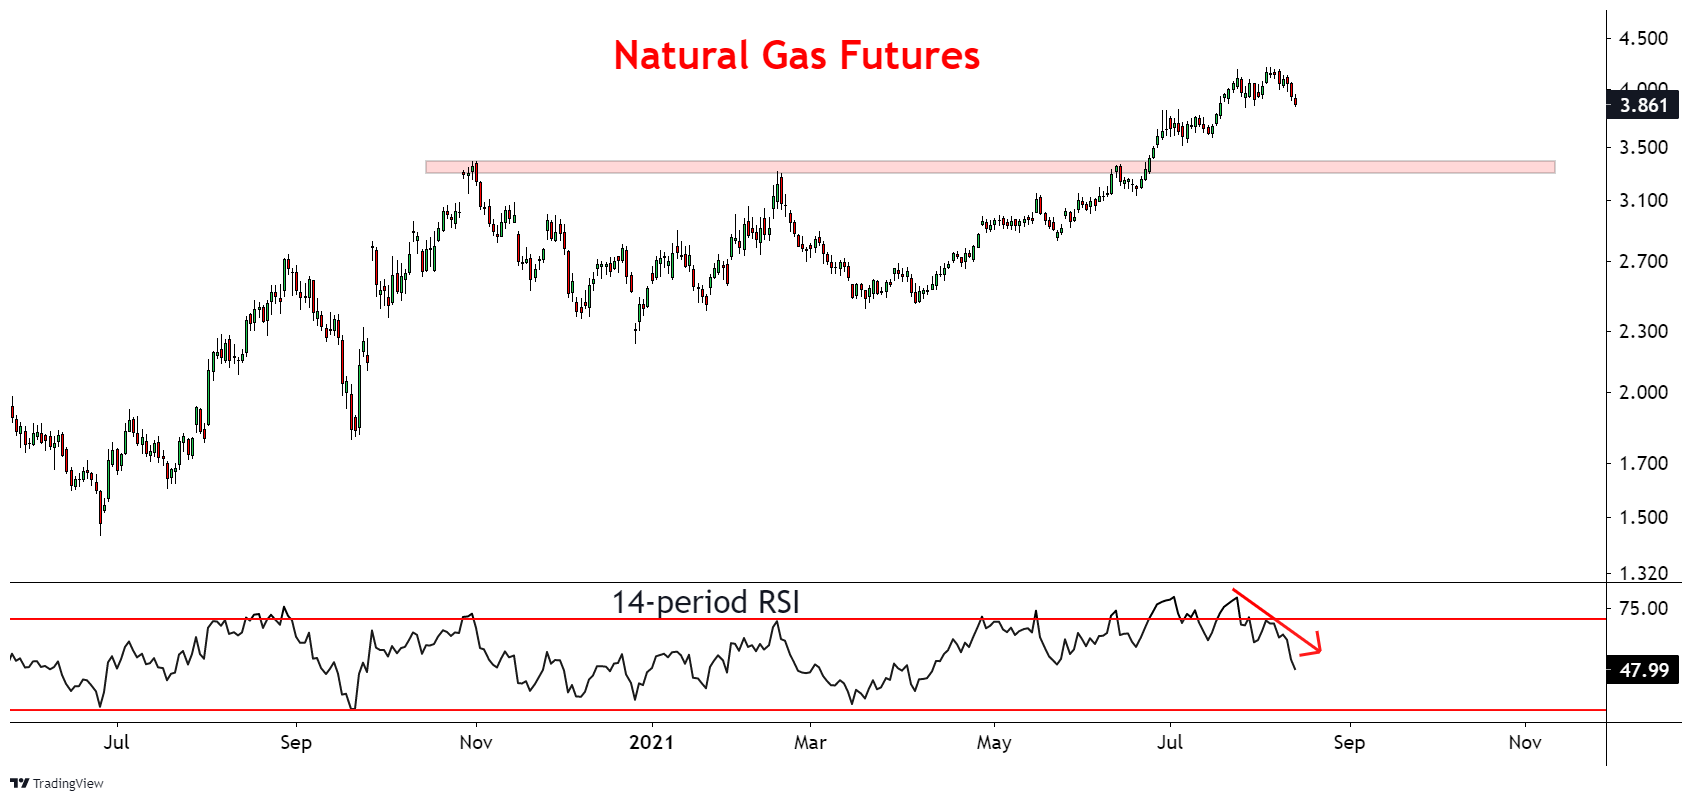
Ignoring production, consumption, storage and other lagging data - I want to focus on the best leading indicator of them all, Price. Below is a long-term line chart of Henry Hub Natural Gas Futures (Continuous) coupled with a 1yr Z-Score reading. It’s no secret that Natural Gas is trading at the higher end of its historical range. However, we know that markets are not normally distributed and a continuation of higher prices is always in the cards.

Below is a snapshot of the weekly MACD indicator. We’re starting to see the MACD line turn down, which may foreshadow a momentum shift and further decline in prices.

Speaking of momentum, the 14-period RSI is displaying a bearish divergence from the most recent price peak. Very notable given the resilience of the current uptrend.
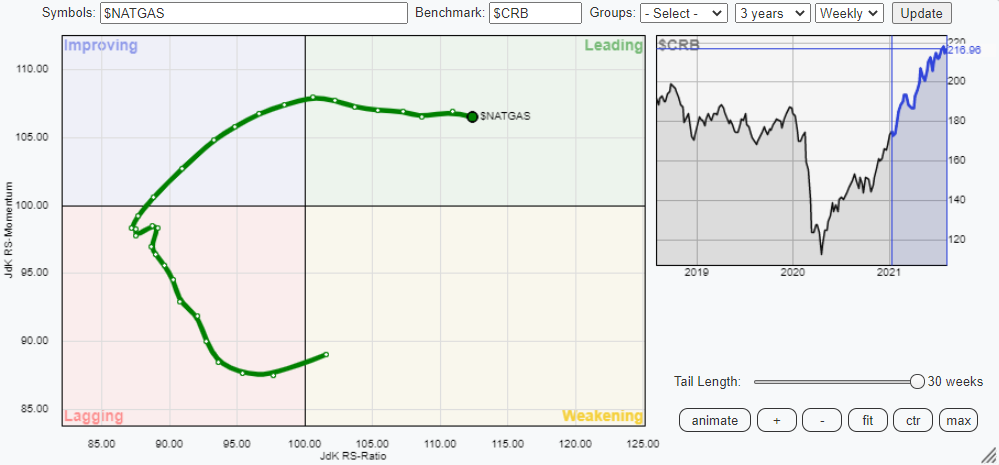
Below is a weekly Relative Rotation Graph (RRG chart) of 14/19 commodities contained in the CRB Index. Coffee and Natural gas remain in the leading quadrant.

This is the 8th week in a row that Natural Gas has remained in the leading quadrant. Nothing bearish about this RRG chart, other than they typically move in a clock-wise fashion - meaning it is likely that Natural Gas will fall off as a relative outperformer as time goes on.
Seasonality and understanding the cyclical nature of commodities can be super helpful. But this summer is a great reminder that we must follow a weight of the evidence approach. One data-point cannot solely drive our investing decision-making!
That’s enough outta me.
SM
Great narrative 🍀