


Going Down The Road, Feeling Bad
A short list of beaten down areas of the market.
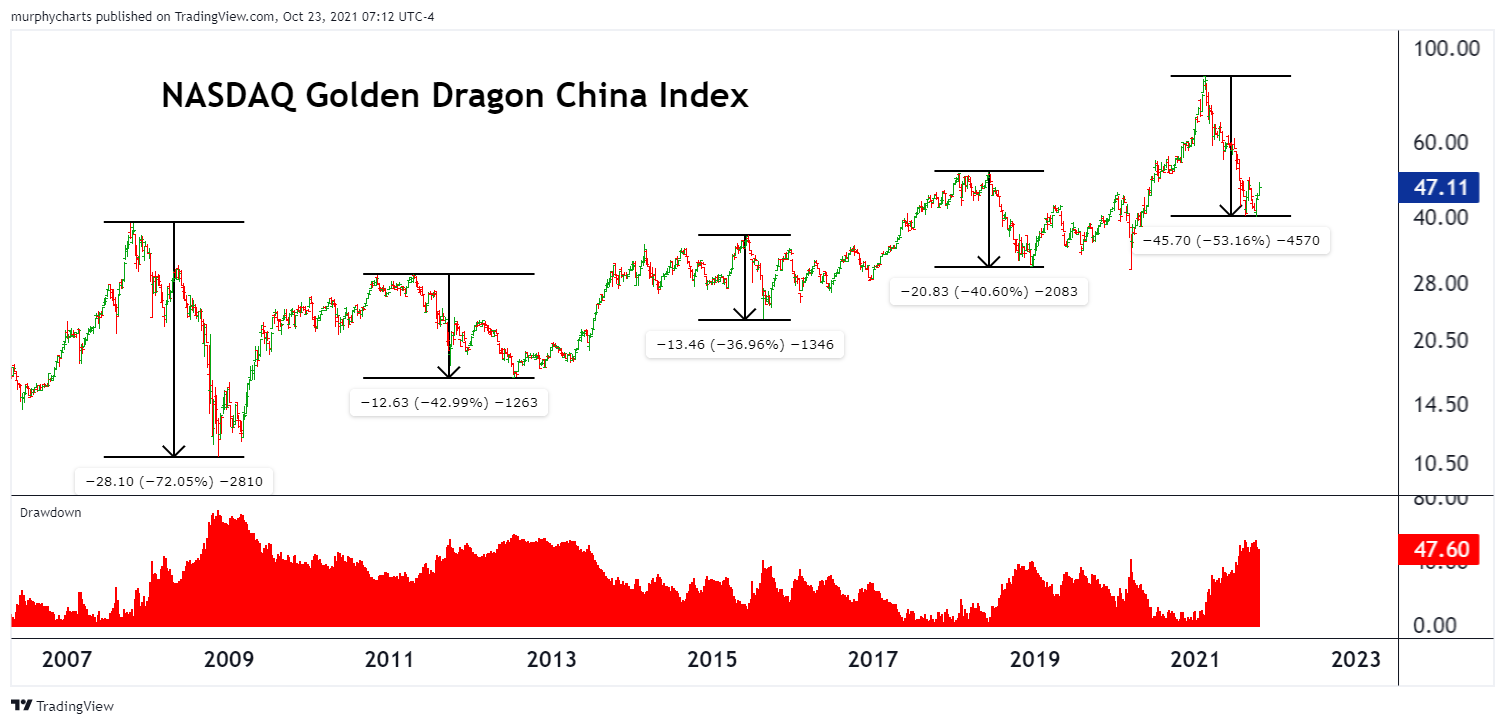
China Equities
In 2021, we witnessed the largest drawdown in the Golden Dragon China index since 2013. It’s very easy to speak down on the 2nd largest economy in the world. Sure the geopolitical risk is plentiful, but how can we justify not having exposure to an economy of this size? Mean reversion traders must be chomping at the bit to own more shares of $BABA, $BIDU or $YY, right?
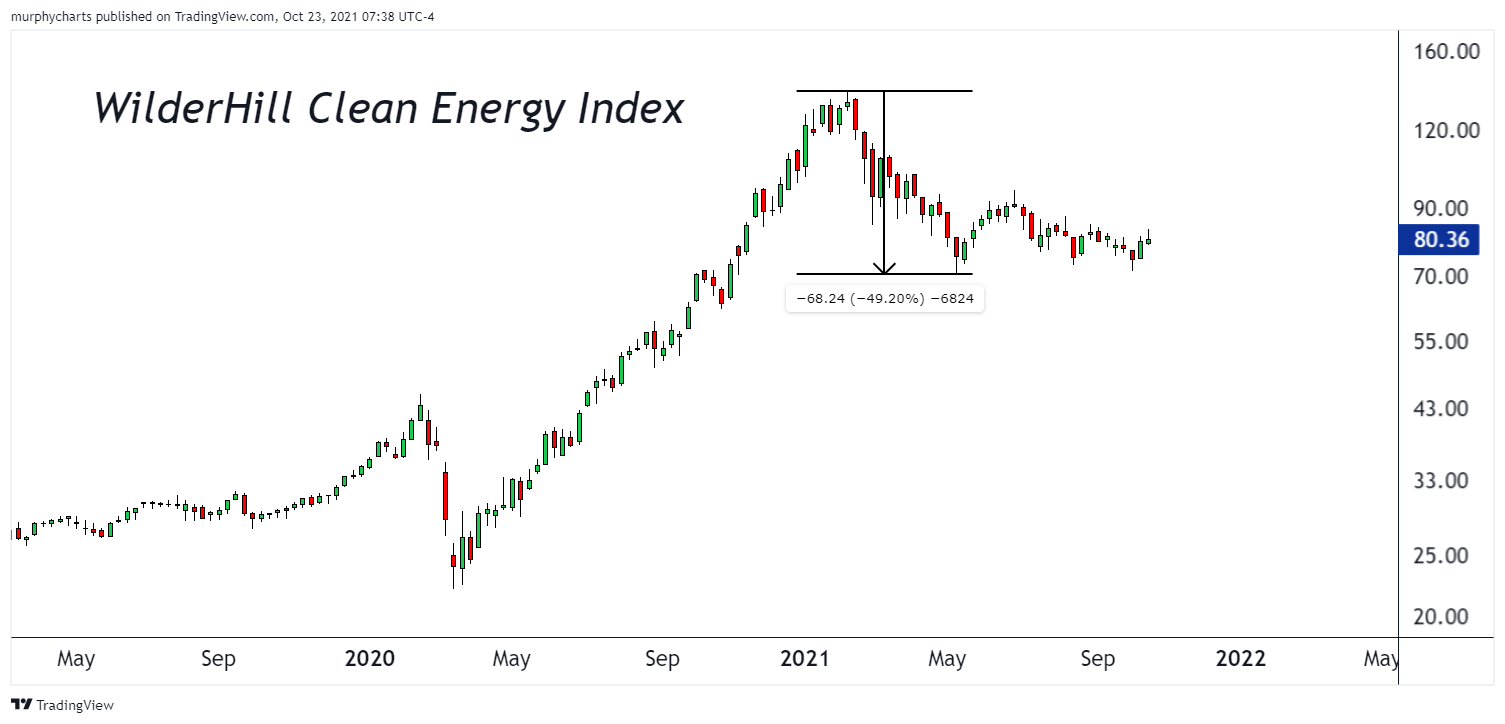
Clean Energy
After a ferocious run up in 2020, this industry has cooled off - clocking in a ~50% drawdown from its 52-week high. The industry has been range bound since May as trend followers are disinterested at the moment.
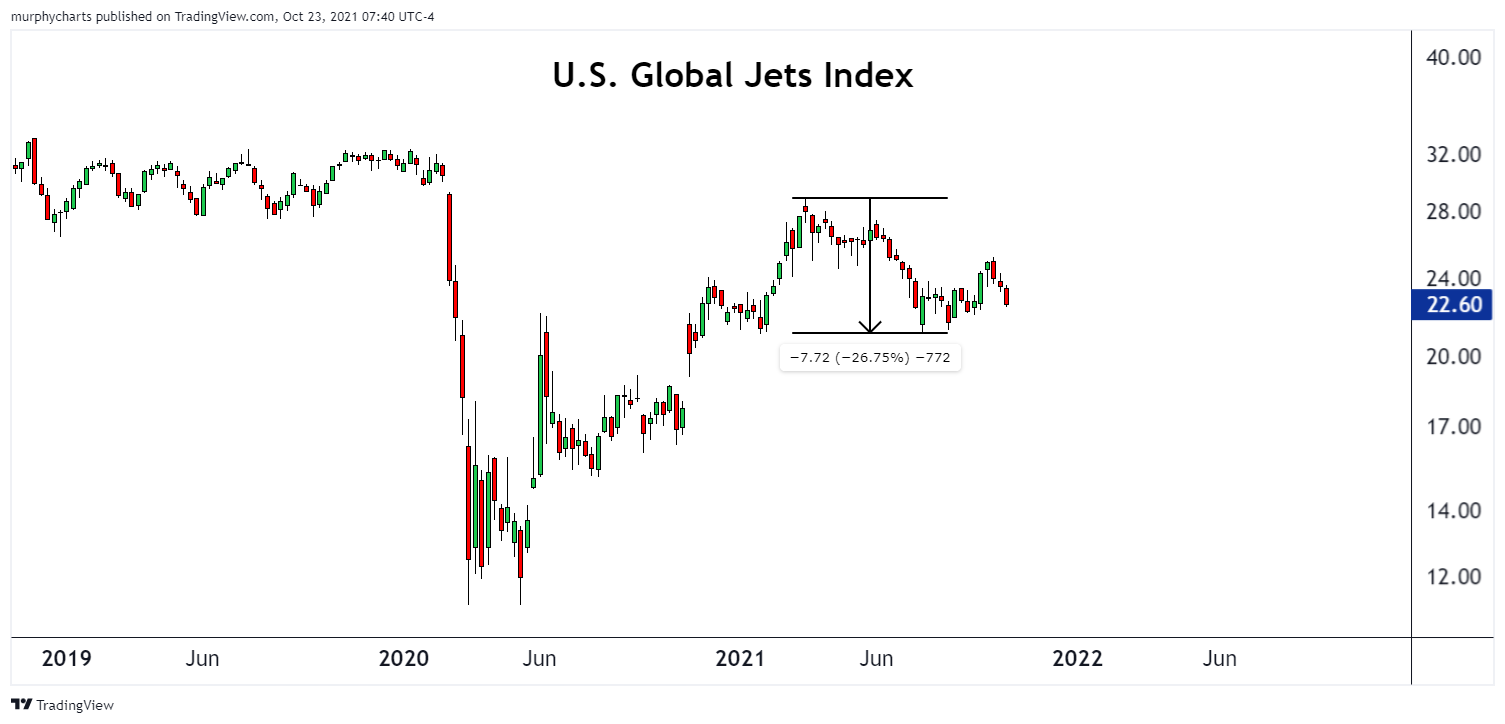
Airlines
A SMID Value industry that has struggled for most of 2021. Its 52-week high was formed in March, clocking in a ~25% drawdown later in July.
Biotechnology
Not as steep a decline as the previous charts mentioned, but noteworthy nonetheless. The industry has struggled to find its footing all year. Picking up two double digit drawdowns on the year.

Video Gaming & eSports
Just this month, the industry formed new lows and increased its current drawdown from all-time highs to ~23.5%. The decline in China equities certainly hurt this industry, as China makes up roughly 20% of the index.

Smart Transportation
Another industry that was on fire last year, but in 2021 all we’ve seen is consolidation. Clocking in a drawdown of nearly ~26%.

Cannabis
Last but certainly not least, we have the cannabis industry. The index made new YTD lows last month and has struggled all of 2021. The below chart displays weekly candlesticks - notice the 5 most recent candles, they have small bodies and relatively large shadows/wicks. This is taking place within a significant support/resistance zone. One who studies price action would say these candles may be indicative of a potential trend reversal. I’d be more confident in saying the displayed price action is indicative of an imminent resolution from the current 1-month range. Up or down is anyone’s guess. We do not have a crystal ball.

Of the indices listed above, below is their YTD performance. Despite the drawdowns we’ve seen, 3 out of 7 are displaying positive YTD returns. In bull markets, we see rotation. We see areas that worked one year, consolidate and fail to work the next year. It may seem like the major indices are all that matters, but across the market there have been industries suffering “bear markets” in their own right. This is a healthy characteristic of an equity bull market.

That’s enough out of me.
SM
Great read👍